
Records and Statistics
Health & Safety Records, Statistics & Trends
An annual summary of statistics shall be maintained.
The summary of yearly statistics will contain the number of:
- New Hire Orientations completed
- Company safety meetings held
- Toolboxes / Tailgates conducted
- Inspections completed
- Vehicle inspections completed
- Vehicle / Damage / Injury Incidents reported
- First Aid / Medical Aid Incidents reported
- Investigations completed
Additionally, a year to year comparison chart of all items will be compiled to determine trends.
Year to Year Comparisons
Year to year safety summaries and comparisons shall be maintained.
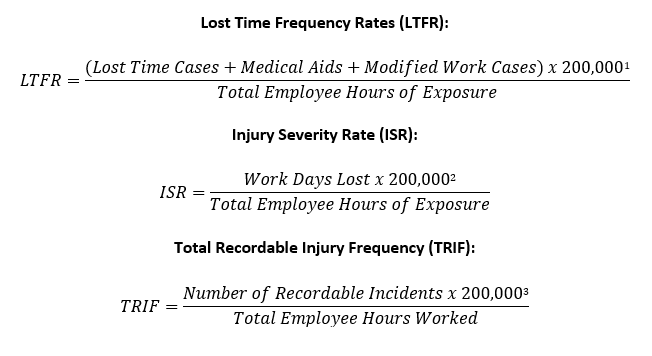
There are three key indicators that must be reported on annually:
- Lost Time Frequency Rate (LTFR)
- Injury Severity Rate (ISR)
- Total Recordable Injury Frequency (TRIF)
These indicators should be calculated as follows:
These and the year to year comparison statistics should be reviewed at a minimum on a yearly basis but it is recommended to be reviewed at the Joint Health & Safety Committee meetings to assist in the reduction of loss through increased awareness and education.
[1] 200,000 hours is an Industry Standard and represents the equivalent of 100 Employees working 1 full year. These statistics do not work effectively when the company’s Employee count is under 40 full time Employees.
[2] Ibid.
[3] Ibid.